We have been measuring the wellbeing of leaders and professionals now for over a decade using the GLWS.
With a dataset of more than 9600 leaders, it is one of the most comprehensive archives on executive wellbeing.
For the first time, we are releasing insights from a decade of data – and the findings present a compelling case for urgent intervention.
Every primary indicator of subjective wellbeing – Happiness, Life Satisfaction, Working Well and Living Well – has declined since 2016 (see graph below).
There have been no exceptions to this trend, and as yet, no signs of recovery.
In August, we will be unpacking this data in greater depth at the AHRI National Convention and Exhibition. For now, here is a preview of our key findings…
A new and concerning revelation
The most recent data tells us something new and concerning: since our last published benchmark of 6,500 leaders to end of 2023, the decline has not only continued — it has sharpened.
Hover over any data point to see exact values.
Life satisfaction has fallen further since 2023 than any other dimension – a drop of 0.22 points in three years. Leaders are not just less happy at work. They are losing their sense that life, overall, is going well.
Is this really significant? Yes — statistically and practically
A reasonable question, looking at score differences of ‘only’ 0.2 or 0.3, is whether they’re big enough to actually matter. At a sample of 9,600+ leaders measured, the answer is unequivocally yes. Sample size at this scale reduces statistical noise to near zero. Differences that replicate across every year for a decade are not random variations — they are reliable signals of something real happening to the leaders and professionals who organisations like yours depend upon.
An important caveat
These results come from organisations already investing in detailed leadership wellbeing measurement — which means, by definition, they are being more proactive than most. It’s possible that in organisations not measuring, not monitoring, and not acting to improve their key talent’s wellbeing, the picture may be worse.
If your organisation is already using the GLWS, it’s ahead of the curve. This data represents a floor, not a ceiling. If you are not yet measuring — this is what you may be missing, and what is likely accumulating unseen.
Five findings worth knowing
1. This is not a post-pandemic blip. The decline predates COVID and has continued through it. Scores have never returned to pre-2020 levels.
2. Work itself is the primary driver. In absolute terms, the Working Well dimension is the lowest indicator and has shown the steepest cumulative fall over the decade. Wellbeing strategies focused on individual resilience while leaving work conditions unchanged are treating symptoms, not causes.
3. Life Satisfaction is the new frontline. Since 2023, Life Satisfaction has fallen faster among professionals than any other dimension — signalling that pressure is no longer contained within work. It is affecting leaders’ overall contentment with life.
4. Happiness is eroding faster than meaning. Leaders’ day-to-day emotional experience is deteriorating — a known early warning signal for disengagement and burnout.
5. 2025 and 2026 show the sharpest recent decline. After partial stabilisation, the latest two years show renewed and steep deterioration across the cohort.
If your organisation is already using the GLWS, it’s ahead of the curve. This data represents a floor, not a ceiling. If you are not yet measuring — this is what you may be missing, and what is likely accumulating unseen.
These four reported indicators are just the tip of the iceberg
The real power of the GLWS lies deeper.
The four global measures shown above — Happiness, Life Satisfaction, Working Well, Living Well — are deliberately high-level. They are the headline indicators, useful for tracking broad trends and making the case for action. But they are, by themselves, blunt instruments. They tell you that something is wrong. They do not, on their own, tell you what to do about it.
That is where the GLWS® becomes genuinely distinctive. The same 9,600+ leaders have responded to a further 132 specific wellbeing questions, each mapped to one of six validated dimensions:
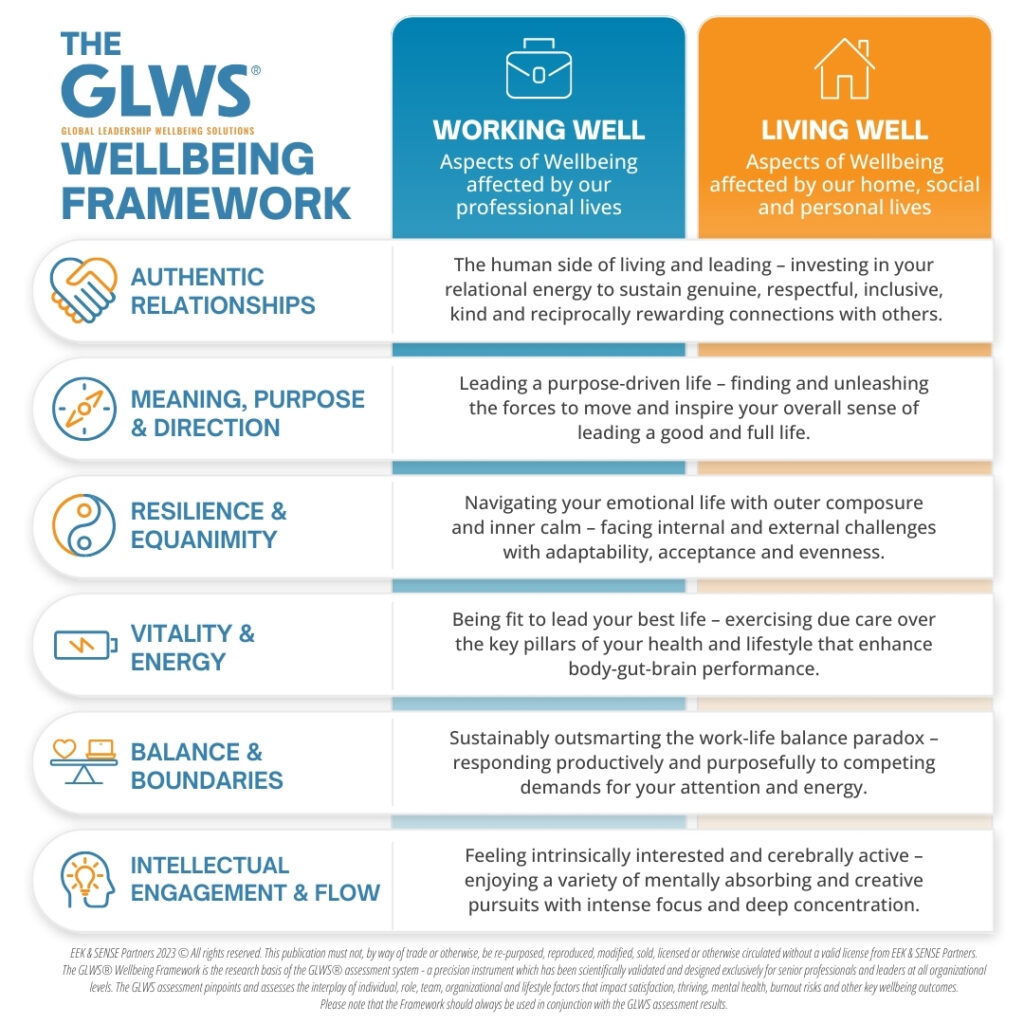
The GLWS Wellbeing Framework is the foundation of the GLWS Wellbeing Assessment System. Evidence based and externally validated by the University of Melbourne’s Centre for Wellbeing Science.
It is at this level — 132 questions, six dimensions, mapped to the individual, the team, and the organisation — that the GLWS moves from measurement to meaningful action. Rather than prescribing a generic wellbeing program, we can identify precisely which dimensions are under the most pressure for specific leaders, and target interventions accordingly. That is how we are able to be confident that what we recommend will make a difference — because we know exactly where the pressure is, for whom, and why.
Three things HR leaders can do now
1. Measure at the right level of depth. Global indicators tell you something is going wrong (or right). The GLWS®’s 132-question, six-dimension framework tells you why, what, where, and for whom — so every intervention can be precisely targeted rather than broadly assumed.
2. Make the case at board level.This data gives you independent evidence to elevate leaders’ wellbeing from being an afterthought to a strategic risk performance and culture conversation. A sustained, statistically significant decline in leadership wellbeing is a business continuity issue. A psychologically safe, agile, healthy and optimistic leadership culture is the difference that unlocks new and sustained value.
3. Shift from programs to conditions.The steepest decline is in Working Well. If your current strategy is weighted toward individual resilience and lifestyle support, it is not addressing the primary driver. The six GLWS® dimensions reveal which structural conditions need to change — and for which individuals and teams.
Hear more at AHRI National Convention & Exhibition — Brisbane, 4–6 August 2026
Audrey will be presenting this research at AHRI NCE 2026 – Australia’s premier HR event – exploring what a decade of data tells us and what bold, evidence-led HR leadership looks like in response, including how to translate population-level trends into targeted, individual-level action.